Introducing ToyBlockCharts - Chart Library

A Glimpse
“ToyBlockCharts” is a chart library for React.
This library aims to transform data into colorful blocks for visual representation, making information more accessible and enjoyable.
You can create a chart like this.

It can be installed as follows:
npm install toy-block-charts
Here is how to use it:
import { StackedBlockChart } from "toy-block-charts";

<StackedBlockChart
  stackType="stable-balanced"
  data={[
    { name: "apple", value: 10 },
    { name: "banana", value: 20 },
    { name: "cherry", value: 30 },
    { name: "date", value: 40 },
    { name: "elderberry", value: 50 },
  ]}
/>;
Introduction
With the evolution of technology, data is abundant in our surroundings.
At the same time, individual preferences are becoming more diverse, and the format and expression of information that each person seeks are also changing. In this context, the accurate understanding and effective use of data are becoming increasingly important.
Data visualization is a powerful tool for conveying complex information in a concise and intuitive manner.
However, many traditional charts, while suitable for general needs, do not fully meet individual specific demands or visual appeal. Therefore, I have developed a new chart library that goes beyond traditional frameworks. This library visually represents data as colorful blocks, aiming to make information more accessible and enjoyable.
In this article, I will detail the features of this library, how to use it, and the background of its development, exploring how data visualization can reach a new level.
Features of the Library
Introduction to ToyBlockCharts
ToyBlockCharts may appear at first glance as just a collection of colorful blocks, but each block visually represents a specific value of data. This library presents data in a stacked block chart format, designed to allow users to process information intuitively.
Key Features
- Intuitive Data Representation: The size of the data is directly reflected in the size of the blocks, making patterns and trends immediately apparent, which may not be as clear from numbers alone. For example, if the data values are 10 and 20, the block for 20 will be twice the size of the block for 10.
- Customizable Stack Types: Users can freely choose how to display the data. Options include stacking from smallest to largest, largest to smallest, or even in a completely random order. This flexibility aids in analyzing data from different perspectives.
- Visual Appeal: ToyBlockCharts are vivid and visually attractive, making them ideal for use in presentations and reports. They draw the observer’s attention and effectively convey information.
Usage Scenarios
ToyBlockCharts can be utilized in a variety of everyday situations such as recording personal hobby activities, creating educational games, or analyzing blog data. The ease of use and visual approach of this tool greatly aid in making data fun and understandable. It is designed for everyone from individuals to families, allowing anyone to easily handle data and enjoy it as part of their life.
How to Use
Note: Please note that this library is in the early stages of development, so changes may occur during use, and there is a possibility of encountering issues.
usage
-
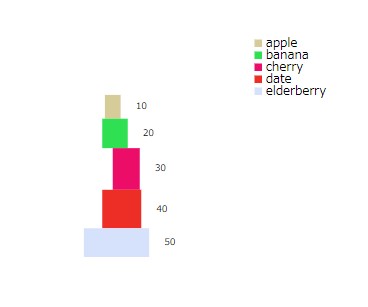
stable-balanced
Blocks are arranged from smallest to largest, in order from top to bottom.
import { StackedBlockChart } from "toy-block-charts"; <StackedBlockChart stackType="stable-balanced" data={[ { name: "apple", value: 10 }, { name: "banana", value: 20 }, { name: "cherry", value: 30 }, { name: "date", value: 40 }, { name: "elderberry", value: 50 }, ]} />; -
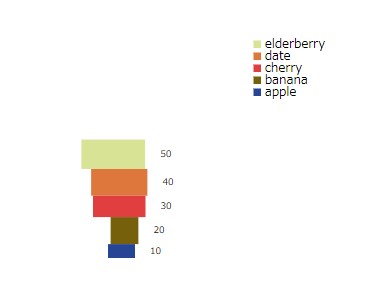
unstable-inverted
Blocks are arranged from largetst to smallest, in order from top to bottom.
import { StackedBlockChart } from "toy-block-charts"; <StackedBlockChart stackType="unstable-inverted" data={[ { name: "apple", value: 10 }, { name: "banana", value: 20 }, { name: "cherry", value: 30 }, { name: "date", value: 40 }, { name: "elderberry", value: 50 }, ]} />; -
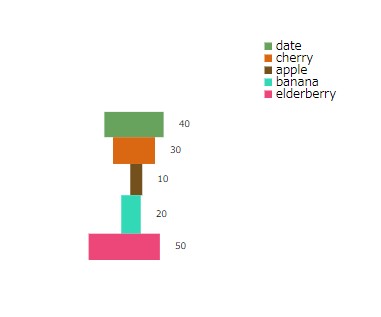
shuffled
The order of the blocks is random.
import { StackedBlockChart } from "toy-block-charts";

<StackedBlockChart
  stackType="shuffled"
  data={[
    { name: "apple", value: 10 },
    { name: "banana", value: 20 },
    { name: "cherry", value: 30 },
    { name: "date", value: 40 },
    { name: "elderberry", value: 50 },
  ]}
/>;
Background of Development
To be honest, I am neither a researcher nor a data scientist, nor am I a genius set to change the world. I am just an ordinary person who has an interest in technology and loves creating things.
Especially, looking at complex data requires a great deal of energy. When tired, the task of viewing charts and graphs can feel burdensome. It was during such times that I thought about how much better it would be if there was a simpler, more approachable way to understand data, which led to the development of this library.
“Make dealing with data more fun.”
StackedBlockCharts is a tool designed to allow anyone to intuitively view data. It uses colors and shapes to represent data like toy blocks, making it visually appealing and instantly understandable.
I hope this library will help make daily interactions with data more enjoyable and effective.
Conclusion
StackedBlockCharts transforms routine data analysis into a new, enjoyable experience by visualizing data in a colorful and fun block format.
Please try using StackedBlockChart in your personal or experimental projects. We look forward to hearing your feedback and new ideas.
We plan to continuously update the library based on the feedback from our users. Let’s explore together how this unique library can enrich your understanding of data and visual enjoyment.
Links
https://github.com/motinados/toy-block-charts
https://www.npmjs.com/package/toy-block-charts
twitter